
Figure 8. Protection by maturation is independent on maturation stimuli and is achieved at an early maturation stage.
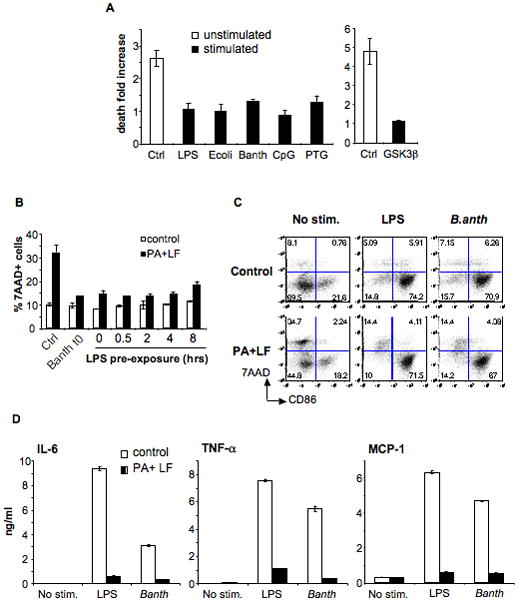
A) DCs were obtained from B6 mice and treated (stimulated) or not (unstimulated) with different maturation stimuli for 8 h: LPS (lipopolysaccharide), E. coli (heat inactivated Escherichia coli), B. anth (sonicated extract of Bacillus anthracis), CpG (CpG DNA), PTG (peptidoglycan); or 16 h: GSK3β (inhibitor of GSK3β, SB216763). Toxins were added during 24 h (PA, 500ng/ml and LF, 20ng/ml) and death was measured by flow cytometry of 7AAD staining on the CD11c+ population. Due to the high autoflorescence of the GSK3β inhibitor, death on that condition was measured by Trypan Blue staining on light microscopy on the total cell population. The fold increase in the number of dead cells is represented for each condition with respect to each control (% of dead cells on toxin treated condition divided by % of dead cells on control condition). Data from a representative experiment done in triplicates (n=3) B) DCs were obtained from B6 mice and treated or not with LPS or a sonicated extract of B.anthracis for the indicated times before addition of PA (500ng/ml) and LF (20ng/ml). t0 indicates that the maturation stimuli and the toxin were added simultaneously. The percentage of 7AAD+ cells within the CD11c+ population after 24 h of toxin treatment is indicated as mean±SD. C–D) DCs were obtained from B6 mice and treated (for 24 h) or not with PA (500ng/ml) and LF (20ng/ml) together with LPS or B.anthracis extract or in the absence of maturation stimuli (No stim.) C) Cells were stained for FACS analysis. The double staining with 7AAD and anti-CD86 on the CD11c+ population is represented. Note that toxin treatment only induced death to CD86− (immature) cells. D) Cytokines secreted on the DCs media were measured by FACS using the Cytometric Bead Array system. Data from one representative experiment done in triplicates (n=3).