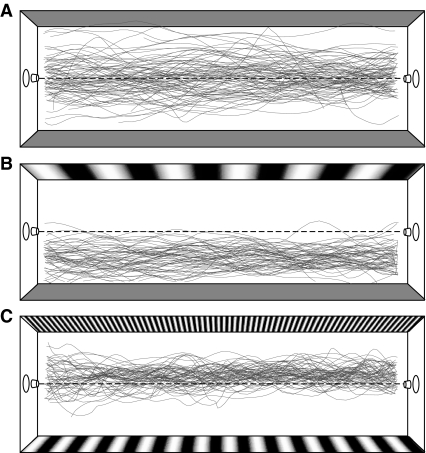
Fig. 2.
Representative flight paths. All the recorded flight paths are shown for experimental trials comparing (A) two gray walls (zero spatial frequency), (B) a 0.05 cycles cm−1 sinusoidal grating and a gray wall, and (C) 0.6 and 0.15 cycles cm−1 sinusoidal gratings. The dashed line denotes the center of the tunnel.

