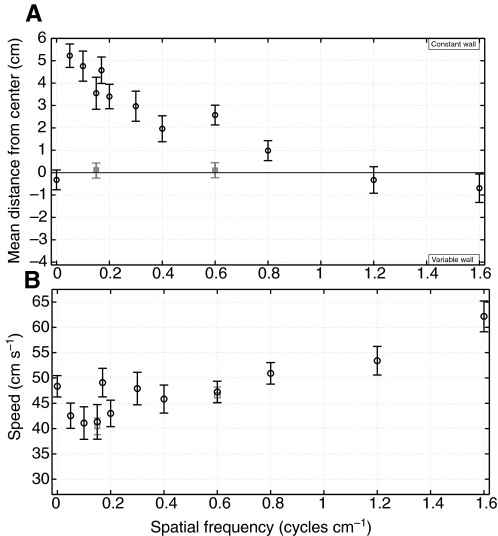
Fig. 3.
Gray wall experiments. (A) The mean lateral distance from the center of the tunnel (black circles) is plotted for bees flying through a tunnel lined with a uniform gray pattern on one wall (constant wall) and a sinusoidal pattern of varying spatial frequency on the opposite wall (variable wall). For comparison, two control trials in which both walls carried the same sinusoidal grating (dark gray squares) are also plotted. (B) The average flight speed is plotted against spatial frequency (black circles) and compared with control trials (dark gray squares). Error bars denote the 95% confidence intervals between groups derived from a Tukey–Kramer multiple comparison test on the one-way ANOVA results. The number of paths analyzed was N=1139, with a minimum of 34 and maximum of 144 paths per trial. Zero spatial frequency represents a uniform gray pattern.

