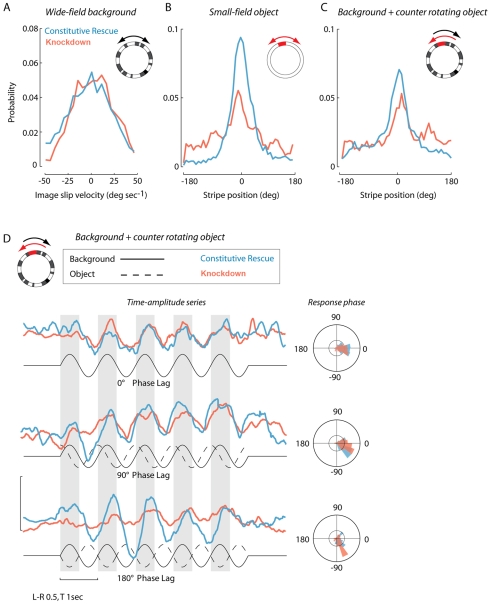
Fig. 7.
Reduced dVGAT compromises visual object fixation behavior. All probability distributions are normalized to the number of data samples such that the cumulative probability equals 1. Statistical tests for (A–C): Kolmogorov–Smirnov two-sample test for probability distribution differences, P-values as indicated below. (A) Mean probability distributions of image slip velocity under conditions in which flies had closed-loop control biased with a sinusoid (see Materials and methods) over a wide-field high-contrast random checkerboard background panorama (inset cartoon). Knockdown (red) N=10; rescue (blue) N=15, P>0.3. (B) Under biased closed-loop conditions, the display was switched to a uniform white panorama with a single dark vertical stripe located by convention at the 0-degree position. Mean probability distributions of image position is indicated such that 0 deg. corresponds to the object being fixated directly in front of the fly. Knockdown N=15, rescue N=15, P<0.01. (C) Same as B, but now the small-field object (stripe) was coupled to the motion of the checkerboard background such that a clockwise movement of the object resulted in a counter-clockwise rotation of the background and visa versa. The two stimuli were 180 deg. out of phase. Knockdown N=15, rescue N=15, P<0.01. (D) Visual stimuli were delivered in open-loop conditions in which the fly had no control over the display, but reacted to the imposed sinusoidal motion by evoking wing steering kinematics, the difference in amplitude of the two wings (L–R; uncalibrated wing beat analyzer signal). As such, image velocity continually varied. We varied the phase lag between the vertical object (stripe) and the checkerboard background. Knockdown N=10, rescue N=15. The solid black line indicates background motion; the dashed line shows the object motion. Gray bars indicate periods of rightward (clockwise) motion. Upward deflections in L–R wing beat amplitude similarly indicate rightward turns. Unpaired Student's t-test, P>0.05 for 0 deg. and 90 deg. phase treatments, P<0.01 for 180 deg. treatment.

