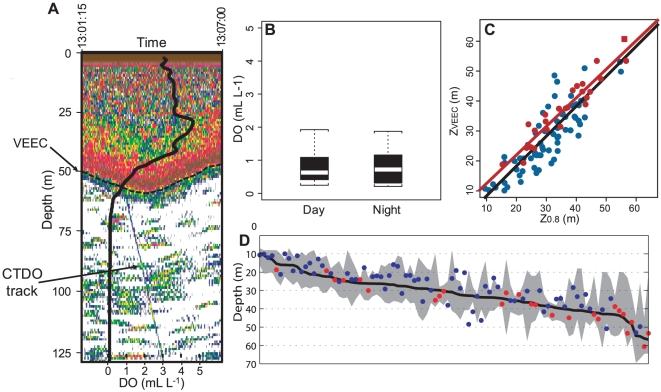
Figure 1. Acoustic detection of the VEEC during the ‘Filamentos 2008’ survey.
A. Example of acoustic echogram showing a CTDO track and the VEEC. The superimposed black solid line is the corresponding DO vertical profile (mL L−1, lower axis). B. Box plot of DO concentration at ZVEEC according to the diel period. C. Relationship between ZVEEC and Z0.8 for the 25 stations with detectable CTDO tracks on echograms (full red circles; the full red square in the upper right corner corresponds to the station presented in A) and the other 71 CTDO stations (full blue circles); Red and black solid lines correspond to the linear regression for the 25 stations with detectable CTDO tracks and for all the 96 stations, respectively. D. Vertical range of the lower oxycline (shaded area) for all 96 stations ranked toward increasing Z0.8 (black solid line); full dots represent ZVEEC for the 25 stations with “visible” CTDO tracks (red) and the other 71 CTDO stations (blue).

