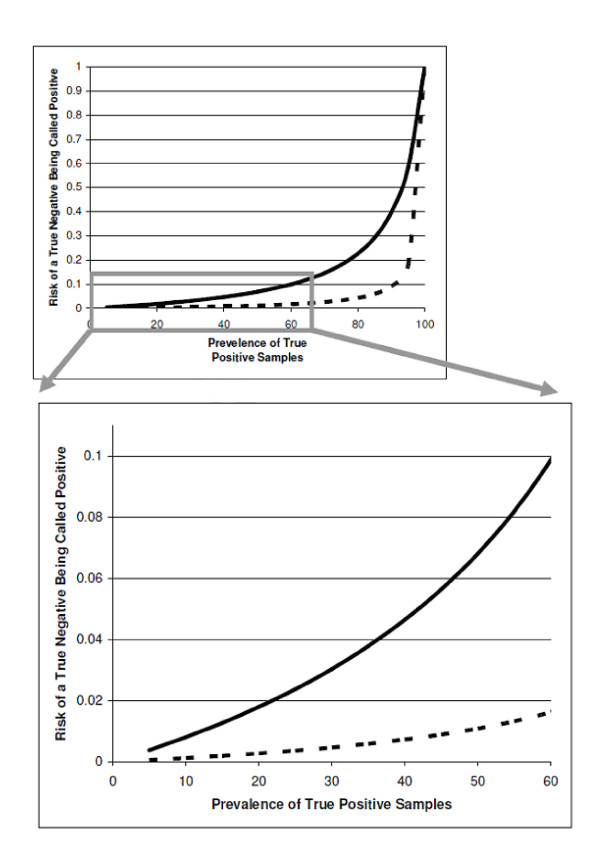
Figure 1.
Calculated risk of a negative patient sample being tested false positive due to cross contamination (Y axis) for different prevalence rates of positive MTB samples (X axis) showing the effect of the different laboratory cross contamination rates - 1.1% (dashed line) and 7.3% (solid line). The upper graph shows the exponential effect of the prevalence of true positives on contamination risk and the low graph shows an enlarged view of the clinically relevant area of the curve from the upper graph.

