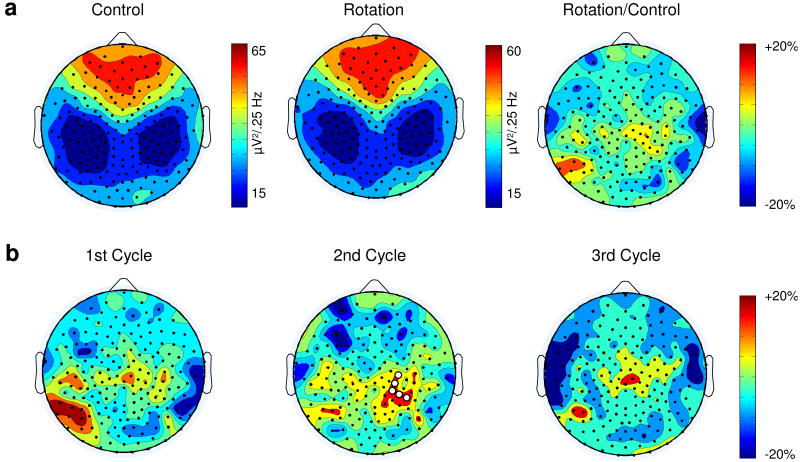
Figure 3.
Morning learning leads to a SWA increase in the right parietal region. (A) Topographic distribution of average EEG NREM power density at 1-4.5 Hz (n=14 subjects) in the control (left) and rotation learning (center) sessions for the entire night. The ratio between the learning and the control session is illustrated on the right. Absolute values color-coded (μV2/0.25 Hz), plotted at the corresponding position on the planar projection of the scalp surface, and interpolated (biharmonic spline) between electrodes. (B) Topographic distribution for the average EEG NREM power density of the ratio between the learning and the control sessions. White dots indicate the five electrodes showing significantly (SnPM, p<0.01) increased SWA in the second sleep cycle 12 hours after visuomotor learning (electrodes 143, 155, 184, 154 and 163).

