
Figure 3. Over-expression of CSF1 in human GBM.
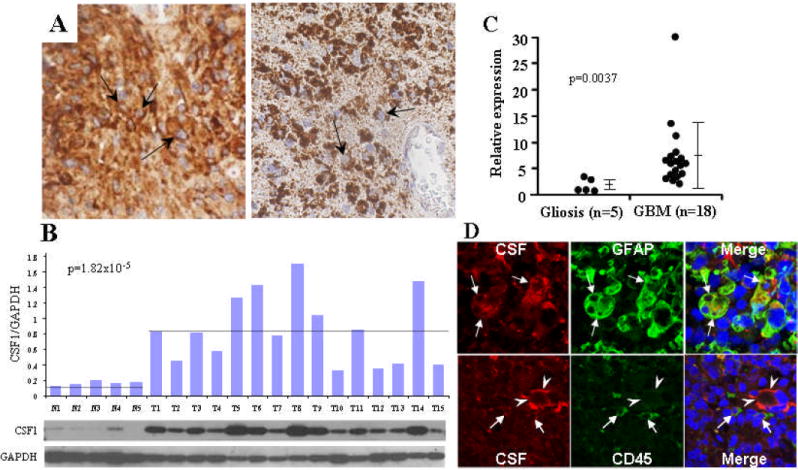
(A) Immunohistochemical staining showing CSF1 (Arrows, right) and CSF1R (Arrows, left) staining in human GBM tissue sections. (B) Western blot of whole cell lysates from normal (post-mortem) brain (N1-N5) as well as from primary human GBMs (T1-T15). Bars represent the ratio of CSF1 to GAPDH signal intensity. (C) qRT-PCR result showing elevated levels of CSF1 transcript in normal (n=5) vs. GBM (n=18) tissue (p-value generated using Wilcoxon rank-sum test). (D) Top: Dual label immunofluorescence images illustrating tumor cells (white arrows) expressing both CSF1 (Red) and the glial marker GFAP (Green). Bottom: Separate immunofluorescence experiment illustrating distinct CSF1 staining in (red) tumor cells (arrowheads) and CD45 staining in (green) infiltrating lymphoid/myeloid cells.