
Figure 2. QT Interval Stretching in Healthy Control Subject and in LQT2 Patient.
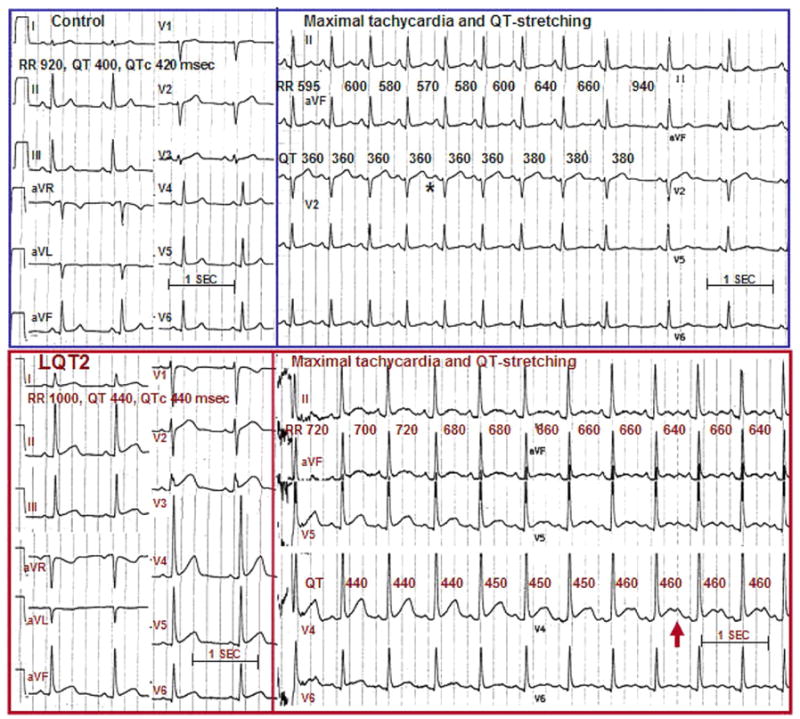
(Top trace) A 39-year-old healthy volunteer. At baseline (left panel), heart rate is 65 beats/min, QT interval is 400 ms, and corrected QT interval (QTc) is 420 ms. Six seconds after standing (right panel), the shortest RR interval is 570 ms; by then, the QT interval has shortened to 360 ms. Since the RR interval shortened more than the QT interval, the QTc interval increased to 480 ms. Maximal QT interval stretching (when the end of the T-wave is nearest the next P-wave) is marked (*). (Bottom trace) A 38-year-old man with long QT syndrome mutation LQT2. At baseline, heart rate is 60 beats/min, QT interval and QTc interval are 440 ms. Note the fairly normal T-wave morphology. Shortly after standing (right panel), motion artifact is visible; the shortest RR interval is 640 ms, and by then the QT interval actually increased to 460 ms. Consequently, the QTc interval increased to 570 ms. Note the development of classic T-wave notching while standing.