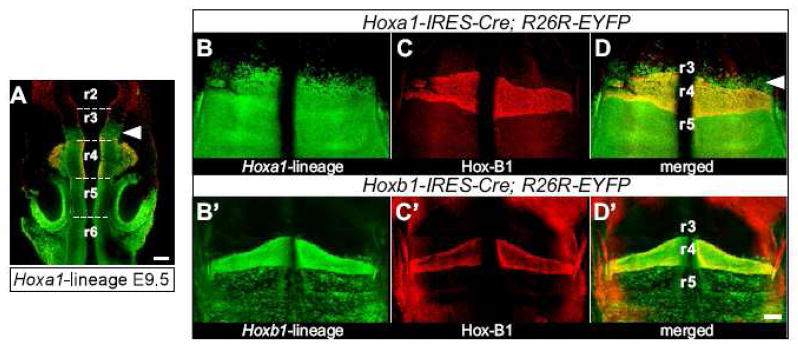
Fig. 2. The anterior border of Hoxa1-lineage in the hindbrain is in r3.
(A) Hoxa1-lineage (green) is seen in the caudal half of rhombomere 3 in a dorsal view of an E9.5 embryo. At this stage, the rhombomeric constrictions are visible (dotted lines) and rhombomere 4 was labeled by immunostaining for Hox-B1 (red). (B–D) and (B′–D′) Hindbrain flatmounts of E10.5 Hoxa1-IRES-Cre; R26R-EYFP and Hoxb1-IRES-Cre; R26R-EYFP embryos, respectively. The lineage of each gene is shown in green (B, B′) and Hox-B1 expression in r4 in red (C, C′). The merged images demonstrate that while Hoxb1-lineage exhibits a sharp anterior border at the r3/r4 boundary (D′), Hoxa1-lineage is present in r3 (D). Scale bars: 100 μm.

