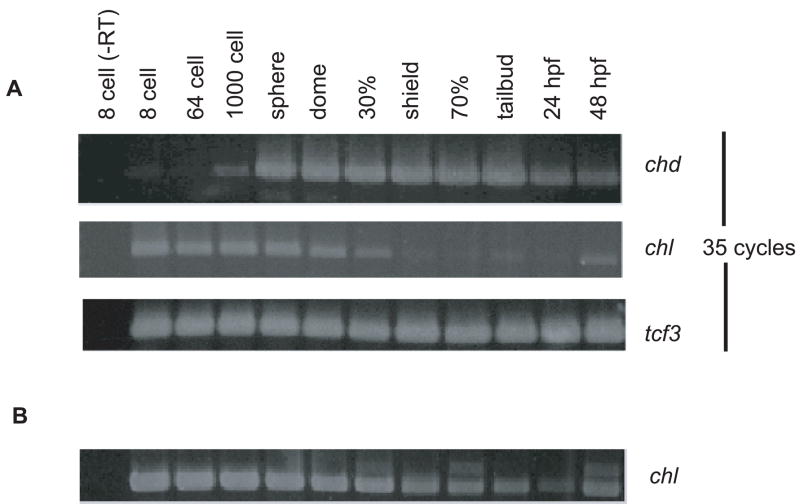
Fig. 2.
Comparison of the temporal distributions of Chl and Chd expression during embryogenesis. (A) RT-PCR analysis of Chl and Chd RNA levels was performed for harvested embryos from 8-cell to 48 hpf stages. PCR was for 35 cycles. Expression levels of transcription factor 3 (tcf3) RNA are shown as a loading control. (B) RT-PCR was performed using 40 cycles to demonstrate presence of Chl RNA transcripts from shield stage through 24 hpf.

