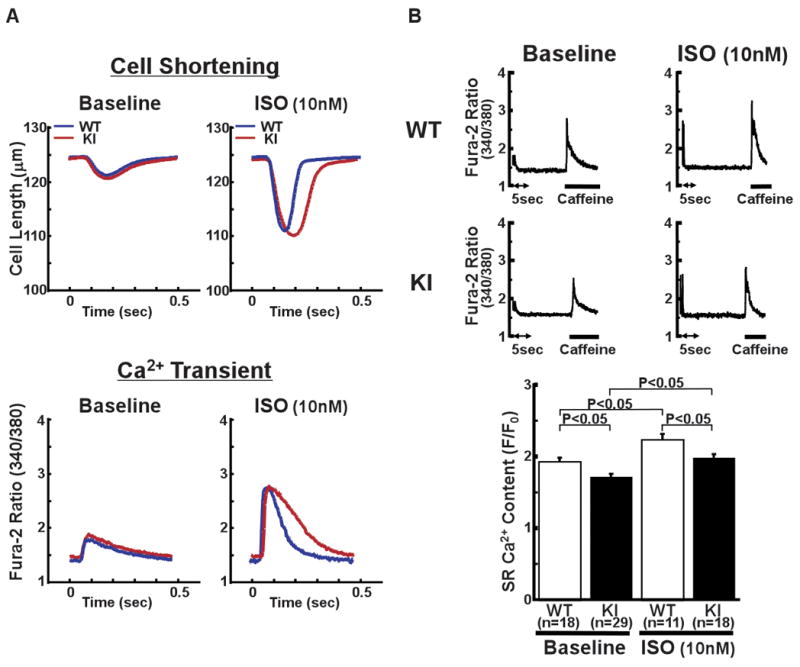
Figure 3.

Cell shortening and intracellular Ca2+ transient in intact cardiomyocytes. A, Representative recordings of cell length and fura-2 fluorescence signal, at a pacing rate of 2 Hz, with isoproterenol (ISO) (10 nmol/L) activation (ISO) and without it (Baseline). B, Representative recording of fura-2 fluorescence signal after addition of caffeine (top figure), which is a measure of the SR Ca2+ content, and the summarized data of SR Ca2+ content (bottom). Caffeine-induced Ca2+ transient was measured by first applying a stimulation train at 2 Hz, and then by rapidly switching the super fusing solution to a solution containing 20 mmol/L caffeine for 5 to 6 seconds. N: the number of cells from 3–9 hearts.
