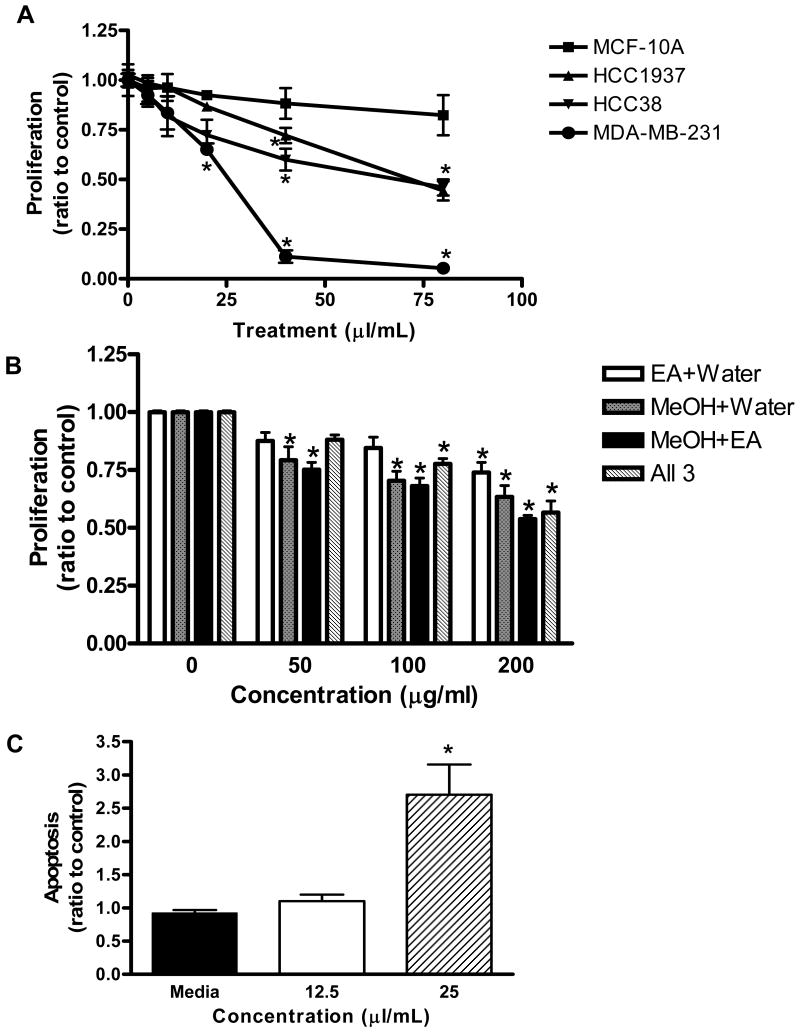
Figure 1. MDA-MB-231 cell proliferation and apoptosis.
(A) Breast cell lines were treated with increasing concentrations of blueberry extract for 72 hours (B) MDA-MB-231 cells were treated with increasing concentrations of blueberry fractions (EA = ethyl acetate, MeOH = methanol, water fractions) for 72 hours. Proliferation was assessed using the CellTiter-Glo Luminescent Cell Viability Assay. Data are expressed as a ratio of treated samples to untreated controls, mean ± SE. Asterisk indicates a significant difference (n ≥ 9, p ≤ 0.01) compared to untreated controls. (C) Cells were exposed to blueberry extract at indicated concentrations for 72h, harvested and analyzed using the Cell Death Detection ELISAPLUS Assay. Values are means ± SE. Data are expressed as absorbance at 405 nm of each treated sample divided by control. Asterisk indicates a significant difference (n ≥ 12, p ≤ 0.01) compared to untreated controls.

