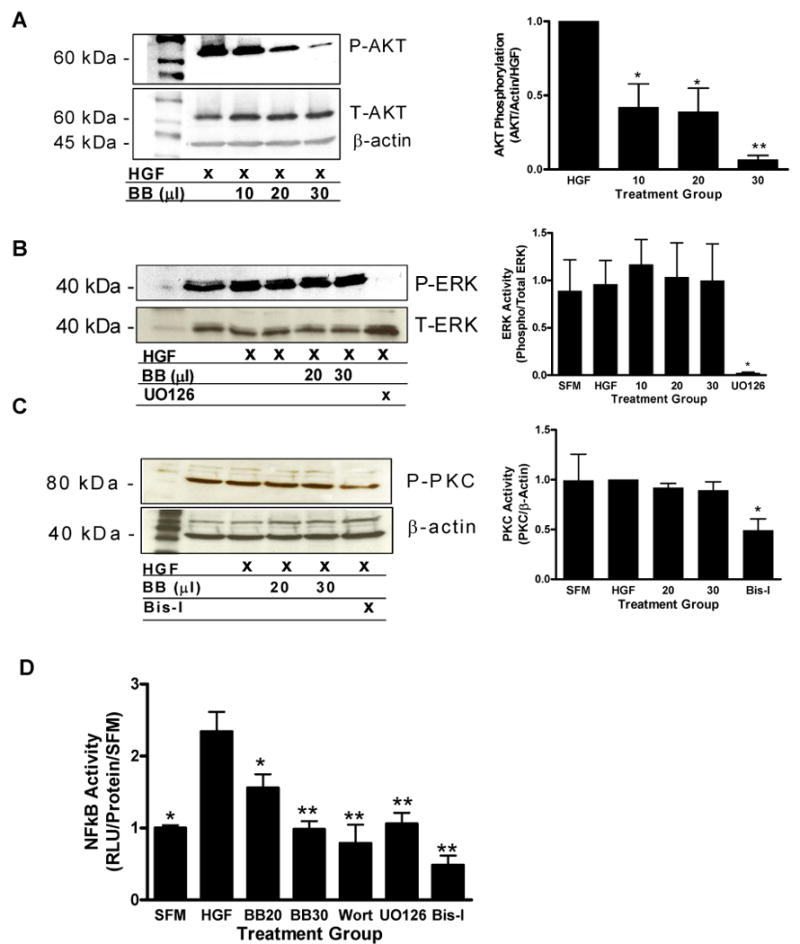
Figure 3. ERK, NFκB and AKT activation in MDA-MB-231 tumor cells.

The phosphorylation of AKT (A), ERK (B) and PKC (C) in cell lysates from blueberry (BB), wortmannin (Wort), UO126 or Bis-I treated cells was determined via western blotting and chemiluninescence. Bar graphs indicate quantification of at least three separate blots using Quantity One software (Biorad). NFκB activity was evaluated via reporter gene assay (D). Luciferase activity was assayed after 24 hours and normalized to total protein. Data are expressed as relative luciferase units as a ratio of treated samples to serum free (SFM) samples. Values represent mean ± SEM, asterisks indicate significant difference from HGF treated controls (single: p ≤ 0.05, double: p ≤ 0.01), n ≥ 3.
