
Figure 6. ERK, NFκB and AKT activation in MDA-MB-231 tumor xenografts.
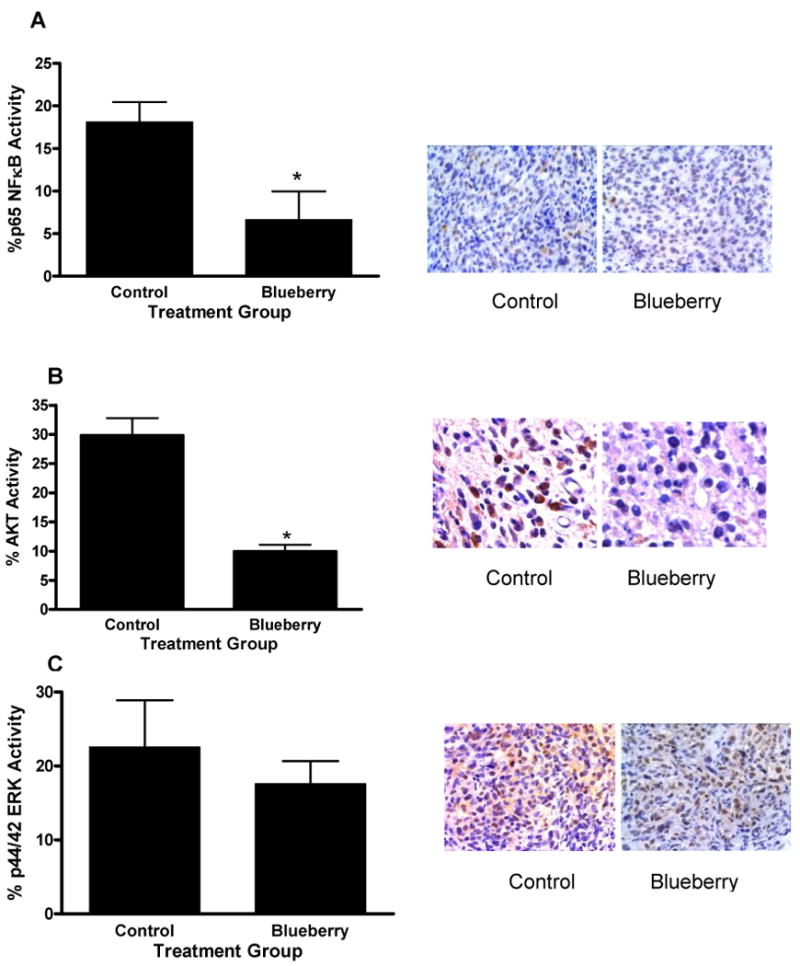
Tumors from blueberry or water treated mice were antibody stained for phospho NFκB (A), AKT (B), or ERK (C) and evaluated via immunohistochemistry. Bar graphs indicate quantification of six random fields; stained and unstained cells were counted and divided by the total number of cells counted to generate the percentage of positive cells in each group. Data represent mean in each group (n ≥ 6 ± SEM). Asterisk indicates statistical significance from control group, (p ≤ 0.01).