
Figure 3.
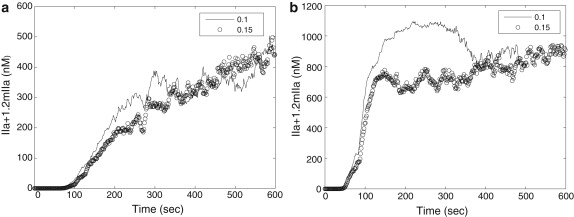
Total thrombin generation in simulations with flow velocity = 0.05 mm/s, 0.5 mm/s, and 1 mm/s, respectively. (a) Total thrombin generation without inhibitors ATIII and TFPI. (b) Total thrombin generation with inhibitors ATIII and TFPI.
Official websites use .gov
A
.gov website belongs to an official
government organization in the United States.
Secure .gov websites use HTTPS
A lock (
) or https:// means you've safely
connected to the .gov website. Share sensitive
information only on official, secure websites.
Total thrombin generation in simulations with flow velocity = 0.05 mm/s, 0.5 mm/s, and 1 mm/s, respectively. (a) Total thrombin generation without inhibitors ATIII and TFPI. (b) Total thrombin generation with inhibitors ATIII and TFPI.