
Figure 2.
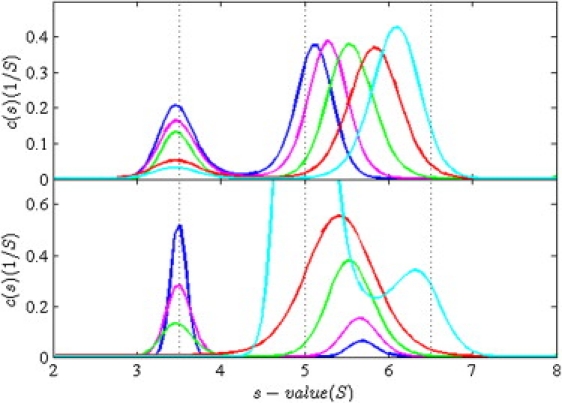
Sedimentation coefficient distributions c(s) representing the boundary patterns of the interacting system of Fig. 1 at different total loading concentrations. The vertical lines indicate the s values of the free and complex species. (Top) Dilution series with equimolar concentrations at 0.1 KD (blue), 0.3 KD (pink), KD (green), 3 KD (red), and 10 KD (cyan). The c(s) distributions are normalized relative to the total loading concentrations. (Bottom) Titration series of a constant total concentration cAtot= KD of the smaller species A with increasing concentrations cBtot of 0.1 KD (blue), 0.3 KD (pink), KD (green), 2.366 KD (red), and 10 KD (cyan). Distributions are not normalized. For both panels, sedimentation and reaction parameters are as in Fig. 1, with signal coefficients of 40,000 M−1 cm−1 and 60,000 M−1 cm−1 for A and B, respectively.