
Figure 5.
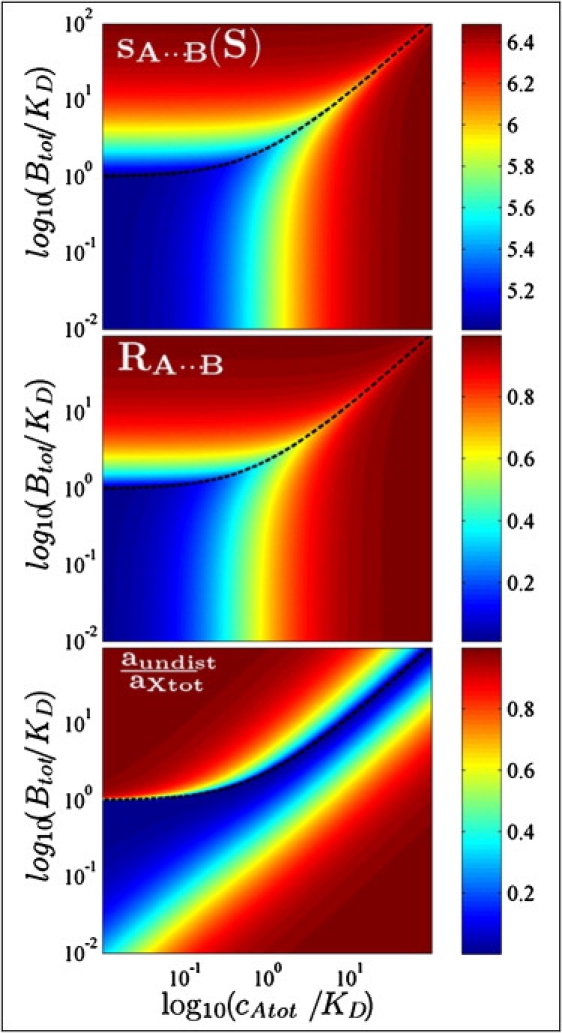
Properties of the reaction boundary A⋯B as a function of the total loading concentration of A and B, calculated by EPT for the system of Fig. 1. (Top) Velocity of the reaction boundary sA⋯B following Eq. 6. (Center) Composition RA⋯B of the reaction boundary following Eq. 7. (Bottom) Fractional signal of the undisturbed boundary, assuming that both components are globular with equal weight-based extinction coefficients. In all plots the line for the phase transition cBtot∗(cAtot) is shown as a black dotted line, separating the region of A⋯(B) in the upper-left quadrant from B⋯(A) elsewhere.