
Figure 4.
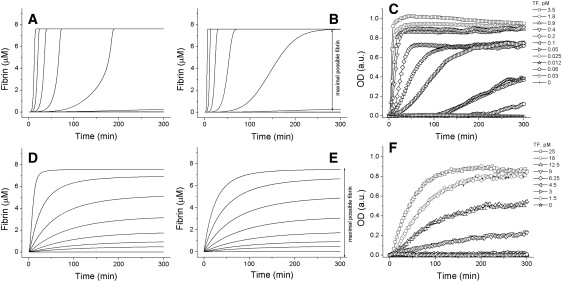
The effect of factor V on the time course of clotting. Theoretical (A, B, D, and E) and typical experimental (C and F) kinetics of clotting in normal (A–C) and factor V-deficient (D–F) plasma. (A and D) Computer simulations using the original model; (B and E) reduced model (Eqs. 2); (C and F) experiments. TF concentrations are: (A and B) 0.64, 0.32, 0.16, 0.08, 0.04, 0.02, 0.01, and 0 pM, top to bottom; (D and E) 64, 32, 16, 8, 4, 2, 1, and 0 pM, top to bottom; and (C and F) shown in the figure.