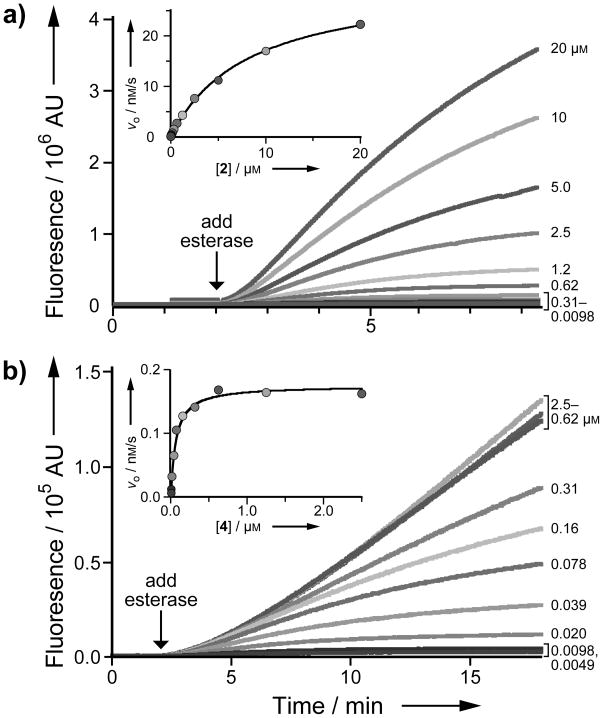
Figure 2.
(a) Kinetic traces (λex 365 nm, λem 460 nm) and Michaelis–Menten plot (inset) for the hydrolysis of pro-fluorophore 2 (20 μM→9.8 nM) by PLE (2.5 μg/mL); kcat/KM = 2.5 × 10⁵ M−1s−1 and KM = 8.2 μM. (b) Kinetic traces (λex 586 nm, λem 620 nm) and Michaelis–Menten plot (inset) for the hydrolysis of pro-fluorophore 4 (2.5 μM→4.9 nM) by PLE (2.5 μg/mL); apparent kcat/KM = 1.2 × 10⁵ M−1s−1 and apparent KM = 0.14 μM.

