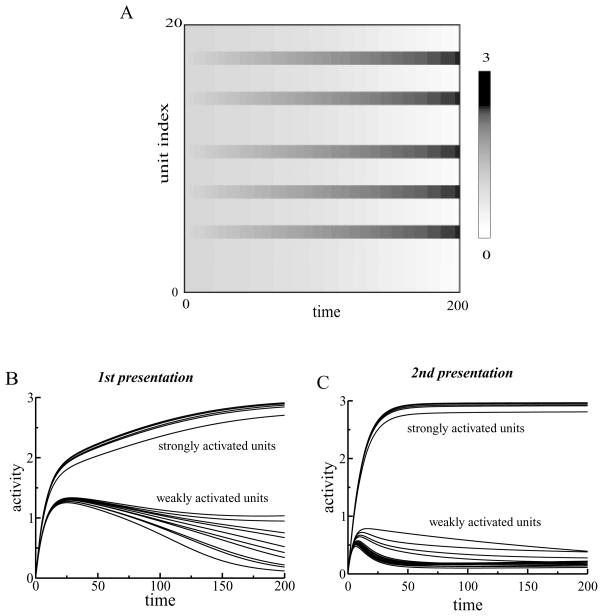
Figure 2.
(A) Dynamics of the activity levels of L1 units. External inputs were randomly chosen. Five units received stronger inputs (mean = 7) than other units (mean = 5). The activities of those five units increased with time, while the activities of the other units decreased. (B) Dynamics of L1 units during the first presentation of a stimulus. After a rapid increase in activity, the units separated into two groups. The activities of units receiving stronger inputs continued to increase, while the activities of weakly activated units decreased. (C) Dynamics of L1 units during the second presentation of the stimulus. The two groups of units separated earlier for the repeated presentation of the stimulus.

