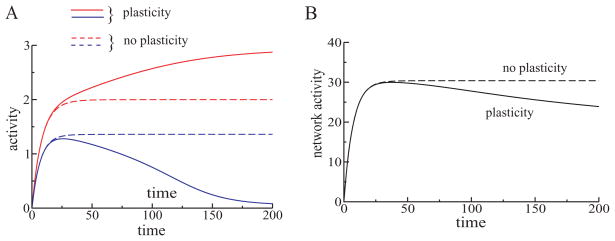
Figure 4.
(A) Representation sharpening in L1 in the rate model was due to plasticity in the excitatory recurrent connections. Dynamics of activity of one strongly responding unit (red curves) and a weakly responding unit (blue curves) were different with synaptic plasticity (solid curves) and without plasticity (dashed curves) in recurrent excitatory connections. If the recurrent excitatory connections were adjustable, there was a monotonic separation between activities of L1 units; the stronger unit increased its activity with time, while the weaker unit decreased its activity (solid curves). However, without plasticity in the excitatory recurrent connections (learning rate α = 0), the units quickly reached their steady states and remained there for the rest of the stimulus presentation (dashed curves). The difference in the steady-state activity levels was a consequence of different input strengths. (B) Dynamics of the total activity of L1 network (sum of activities of L1 units) with and without plasticity in the recurrent excitatory connections. Although the strong units increased their activities with repetition, the total activity of L1 units decreased with time, when plasticity was present (black solid line). This was because only a few units became stronger, and many more units decreased their activity. Without plasticity in the recurrent connections, the total activity did not decrease but instead reached a steady state (black dashed line).

