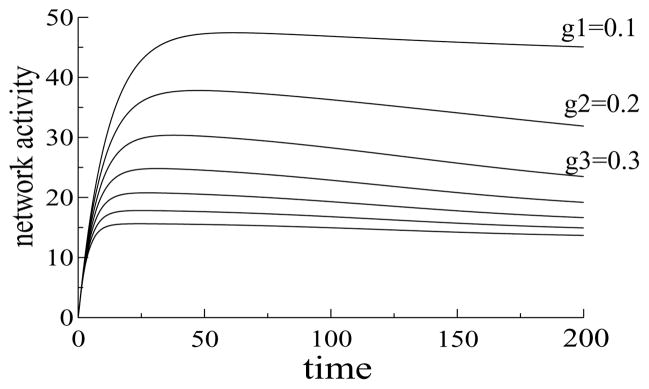
Figure 6.
Dynamics of the total activity of L1 network (sum of activities of L1 units) for different strengths of the inhibitory connections. When inhibition was weak (b = 0.1), the total activity of the network was high (highest line), and with strong inhibition (b = 0.7), the total activity was low (lowest line). However, for all values of the inhibitory strengths, the total activity decreased with time, which was a consequence of neural suppression in L1.

