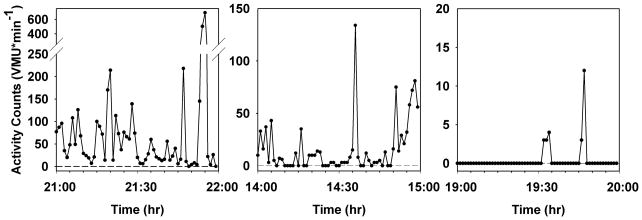
Figure 2.
Selected minute-by-minute vector magnitude unit (VMU) records of activity monitor recording, representing one hour each of high activity (left panel), sedentary activity (center panel), and a non-wearing period during the night (right panel). Note differences in ordinate scales in the three plots. See text for implications of differing analysis strategies for these data.

