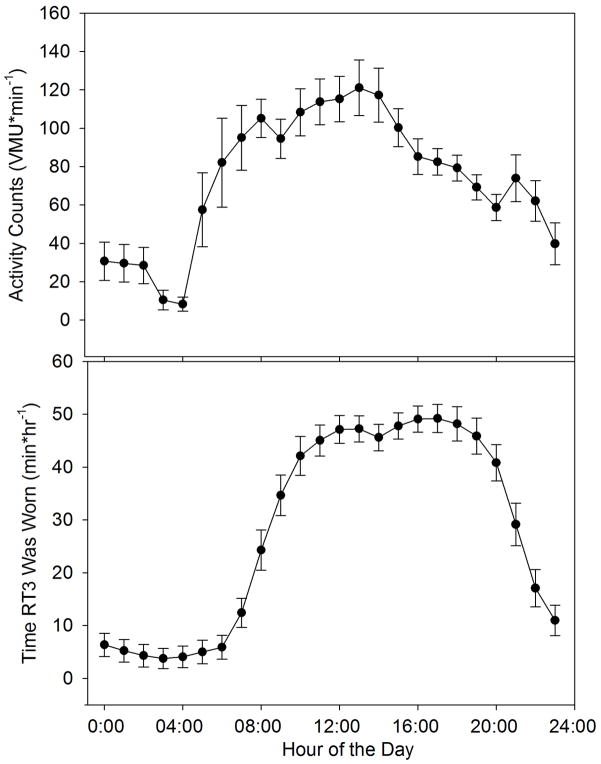
Figure 4.
Average daily activity profiles for all 22 subjects, averaged over the 14 day observation period (mean ± SE). Upper plot: average vector magnitude units (VMU) for each hour of the day. Lower plot: average minutes in which the activity monitor was worn during each hour over the course of the day.

