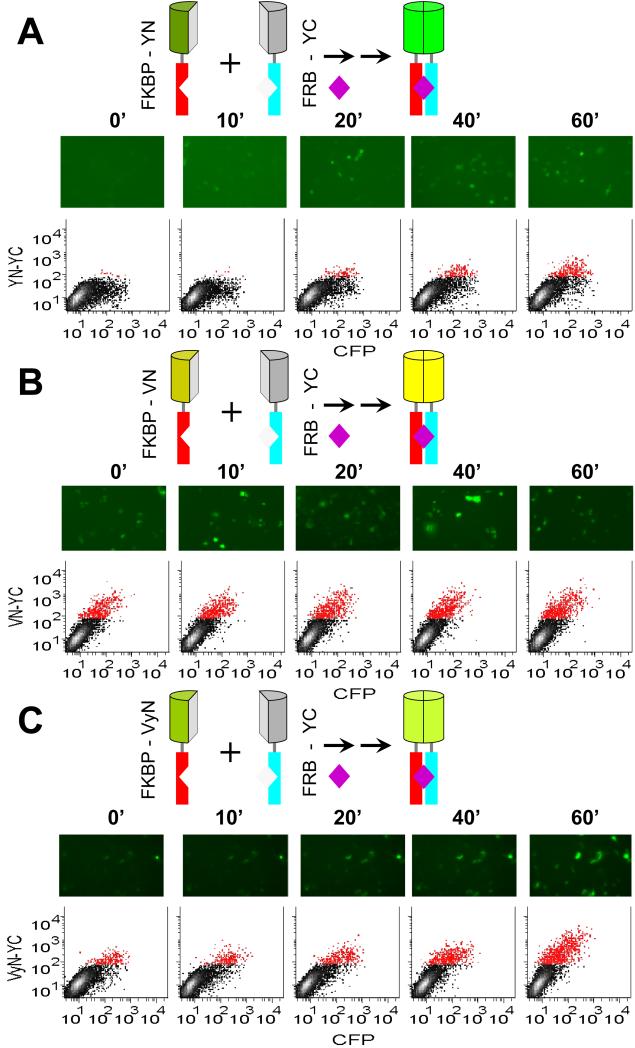
Figure 1. Time-course of fluorescence complementation upon FKBP-FRB interaction.
(A) Rapamycin inducibility of BiFC complex formation by FKBP-YN and FRB-YC. The diagrams above the images represent the fusion proteins expressed in the cells and the complex formed upon rapamycin (purple diamond) addition. The N-termini of the fusion proteins point down in these diagrams. Cells that expressed FKBP-YN and FRB-YC together with a CFP normalization control were cultured at 37 °C, treated with 100 nM rapamycin at time 0 and fixed at the times indicated. The cells were imaged by microscopy and their fluorescence intensities were measured using flow cytometry. Each image shows a field with approximately 100 cells, only some of which are fluorescent because the fusion proteins were transiently expressed in only a subpopulation of the cells. Each scatterplot shows the fluorescence intensities of 10,000 cells with CFP fluorescence shown on the horizontal axis and BiFC fluorescence on the vertical axis. Cells that had BiFC intensities higher than the background signal of more than 99% of non-transfected cells were plotted in red color. (B) Rapamycin inducibility of BiFC complex formation by FKBP-VN and FRB-YC. Cells were treated and analyzed as described in part (A) except that FKBP-VN was used instead of FKBP-YN. (C) Rapamycin inducibility of BiFC complex formation by FKBP- VyN and FRB-YC. Cells were treated and analyzed as described in part (A) except that FKBP-VyN was used instead of FKBP-YN and the cells were imaged live.

