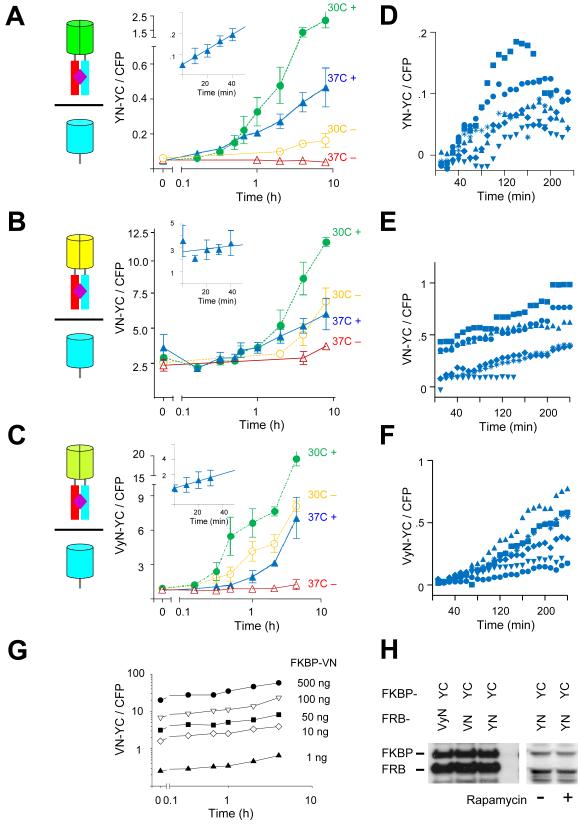
Figure 2. Quantitative analysis of the kinetics and inducibility of BiFC complex formation by different fluorescent protein fragments fused to FKBP and FRB in cell populations and individual cells.
(A) Time-course of fluorescence complementation following rapamycin treatment of cells that expressed FKBP-YN and FRB-YC. The diagrams represent the BiFC complexes formed in the cells as shown in Figure 1. The graph shows the mean ratio of BiFC to CFP fluorescence measured by flow cytometry plotted as a function of time after the addition of 100 nM rapamycin (filled symbols). Cells cultured in the absence of rapamycin were analyzed in parallel (open symbols). The cells were incubated at 37°C prior to stimulation, kept at 37°C (triangles) or shifted to 30°C (circles) at time 0. The data represent means and standard deviations of three to five independent experiments. Note that the time axis is logarithmic. The inset shows the data at early times after stimulation on a linear scale. (B) Time-course of fluorescence complementation following rapamycin treatment of cells that expressed FKBP-VN and FRB-YC plotted as described in part A. The data represent means and standard deviations of three independent experiments. (C) Time-course of fluorescence complementation following rapamycin treatment of cells that expressed FKBP-VyN and FRB-YC plotted as described in part A. The data represent means and standard deviations of three independent experiments. (D) Time-course of fluorescence complementation in individual cells that expressed FKBP-YN and FRB-YC cultured at 37 °C following the addition of 100 nM rapamycin at time 0. The cells were imaged by microscopy at 10 minute intervals. Cells were cultured in CO2 independent medium. The fluorescence intensities of individual cells were quantified and plotted using different symbols. (E) Time-course of fluorescence complementation in individual cells that expressed FKBP-VN and FRB-YC imaged by microscopy as described in part D. (F) Time-course of fluorescence complementation in individual cells that expressed FKBP-VyN and FRB-YC imaged by microscopy as described in part D. (G) Effects of the amount of plasmid encoding FKBP-VN transfected on constitutive and inducible BiFC complex formation with FRB-YC. The indicated amounts of the FKBP-VN plasmid were transfected with 500 ng FRB-YC plasmid and the cells were treated with 100 nM rapamycin at time 0. The cells were fixed at the times indicated and analyzed by flow cytometry. The graph shows the mean ratio of BiFC to CFP fluorescence as a function of the time after rapamycin treatment. (H) Comparison of the expression levels of FKBP and FRB fused to the fluorescent protein fragments indicated above the lanes. Extracts of cells transfected with plasmids encoding the combinations of fusion proteins indicated above the lanes were analyzed by immunoblotting using anti-GFP antibody. The cells either treated with rapamycin (+) or untreated (−) as indicated below the lanes.

