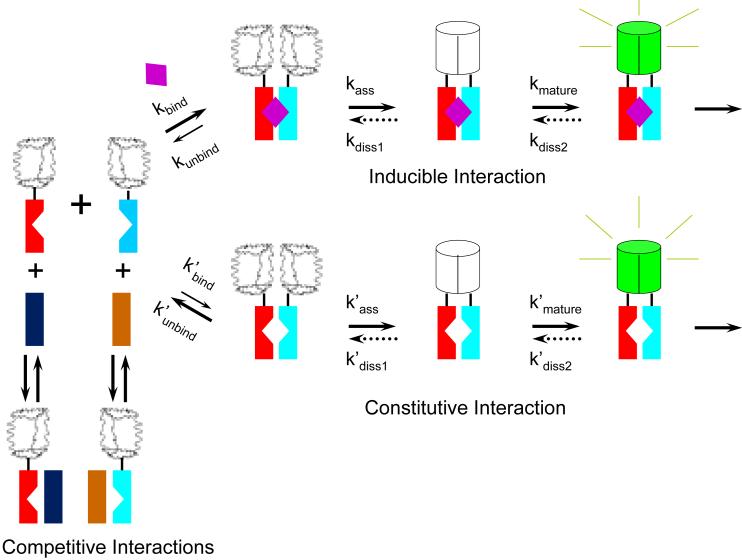
Figure 9. Model for the pathways that affect inducible and constitutive BiFC complex formation.
The diagrams represent intermediates in the pathways for BiFC complex formation. Wavy shapes represent unfolded fluorescent protein fragments whereas cylinders represent folded BiFC complexes. The rates of rapamycin binding (kbind), fluorescent protein fragment association (kass), fluorophore maturation (kmature) and potential BiFC complex dissociation (kdiss1 and kdiss2) depend on the identities of the fluorescent protein fragment fusions and are discussed in the text. The putative dissociation (dotted arrows), if it occurs, is unlikely to follow the same pathway as complex formation and could produce fluorescent protein fragments that are chemically distinct from the precursors for BiFC complex formation. The notched rectangles represent FKBP and FRB. The un-notched rectangles represent cellular proteins that can form complexes with the fusion proteins. The purple diamond represents rapamycin.

