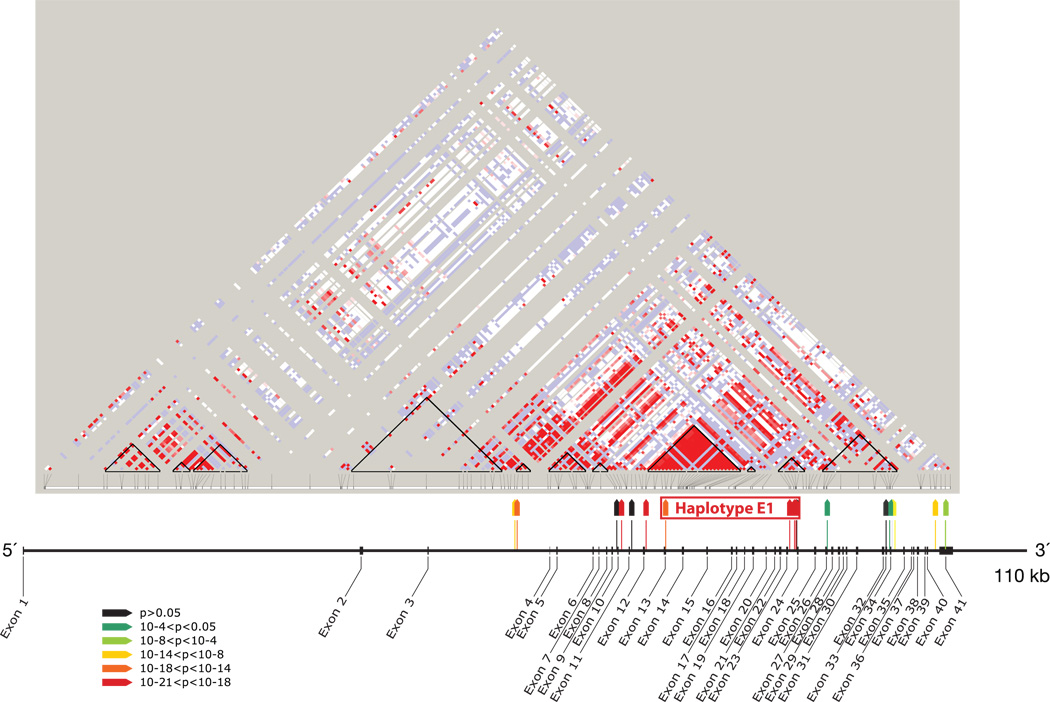
Figure 4. MYH9 linkage disequilibrium and associations.
Location and strength of association of 17 MYH9 SNPs, shown with map of exons of MYH9 and HapMap plot of MYH9 linkage disequilibrium (LD) in Yoruba from Nigeria. Strength of association for SNPs (colored wedges) is keyed by colors as shown. Black triangles on HapMap plot indicate HapMap-defined LD blocks. Haplotype E1 (for “extended haplotype 1”) extends through three HapMap LD blocks. F

