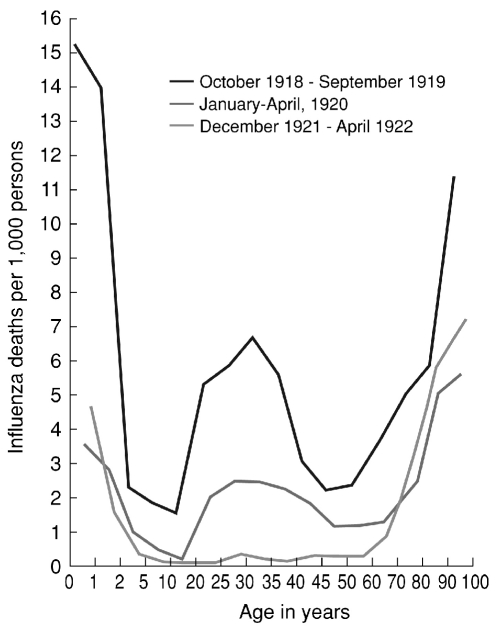
Figure 2.
Age-specific influenza mortality, Breslau, July 1918–April 1922
Note: The top line combines influenza mortality in Wave 2 (W2) and Wave 3 (W3) of 1918–1919. The middle line reflects influenza mortality in the first winter recurrence of January–April 1920 (R1). The bottom line reflects influenza mortality in the R3 winter recurrence of December 1921–April 1922. The young adult mortality peak, documented worldwide, is evident in the W2, W3, and R1 curves of 1919–1921, but completely disappeared by 1922.
Source: Lubinski H. Statistische Betrachtungen zur Grippepandemie in Breslau 1918-22. Zentralblatt fur Bakteriologie, Parasitenkunde und Infektionskrankheiten 1923–1924;91:372-83.

