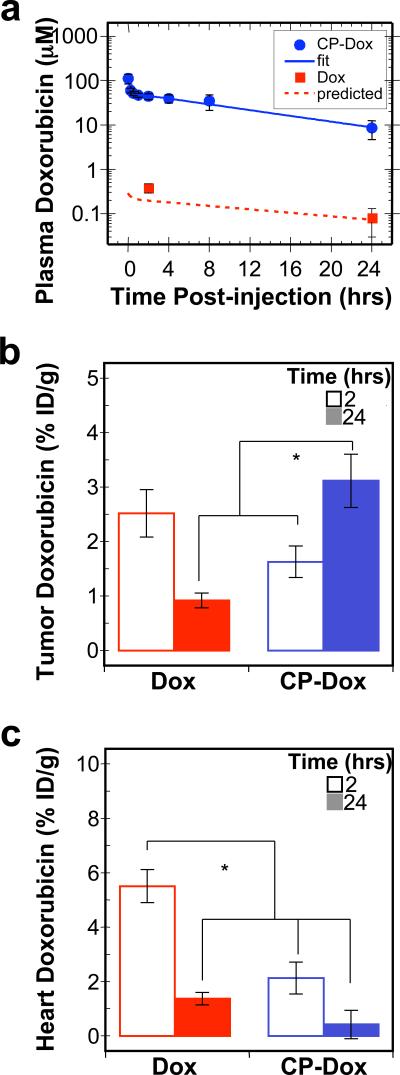
Figure 4. Plasma pharmacokinetics and tissue biodistribution.
a) Plasma Dox concentrations as a function of time post-injection. A two-compartment model was fit to the plasma Dox concentration, which yielded a terminal half-life of 9.3 ± 2.1 hrs (CI 95%) for CP-Dox. The concentration of free Dox has been confirmed at two time points experimentally; furthermore, the observed concentrations correlate with the prediction of a pharmacokinetic model of free Dox in mice (Supplementary Table 3)20. (Mean ± 95% CI; n=5-8). b-c) The Dox concentration in b) tumor tissue and c) heart tissue at 2 and 24 hours post-administration was determined. *indicates p<0.0005 (ANOVA, Tukey HSD). (Mean ± SD; n=4 to 6).

