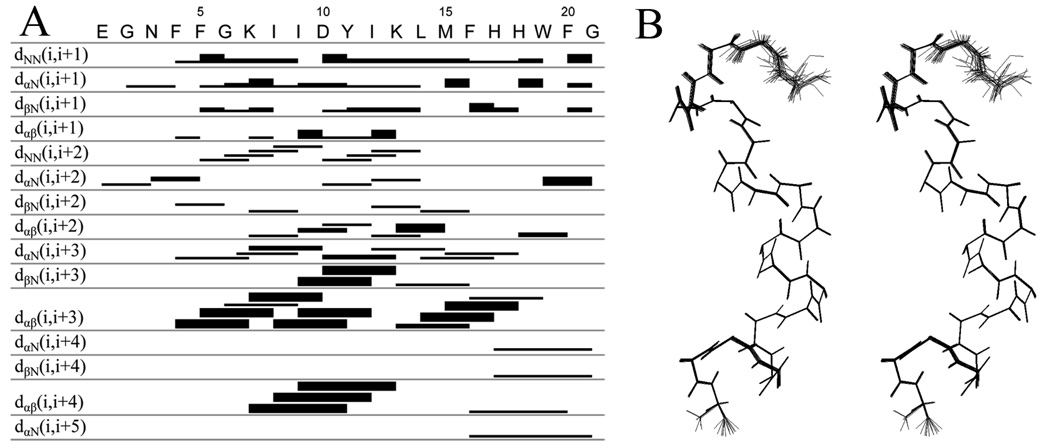
Figure 2.
NOE-connectivity table and stereo view of the peptide backbone. (A) Summary of NOE connectivities from NOESY spectrum (mixing time 200 ms) of PBP 5 anchor in DPC micelle (1:55) at pH 7.4 and 25.0 °C. The thickness of the band (strong, medium and weak) corresponds to the intensity of the NOE interaction between residues. The first four rows indicate interactions between adjacent amino acids. The remaining rows show interactions between the residues at each end of the bar. (B) Stereo view of the 20 overlaid backbone structures of the PBP 5 anchor from the Cyana calculation. The N-terminus of the peptide is on the top. The first three N-terminal residues display several conformations, while two distinct conformations are seen for the Gly21 C-terminus residue of the peptide.

