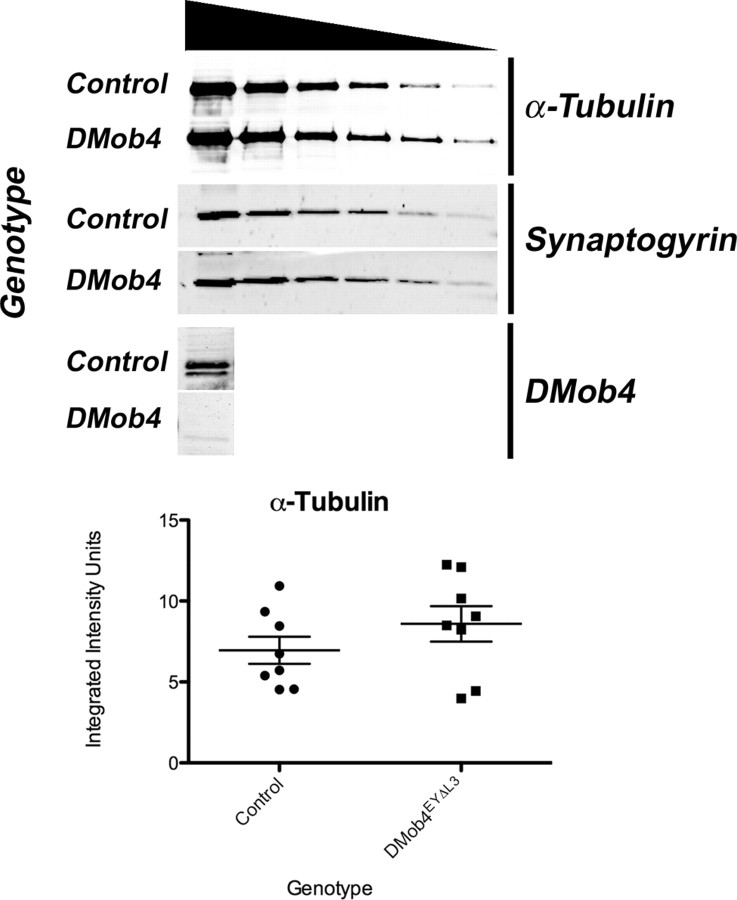
Figure 10.
Western blot analysis of total α-Tubulin levels in third-instar larvae. Serial dilutions of total protein isolated from control and DMob4 mutant larvae (indicated by gradient symbol) were immunoblotted for α-Tubulin and Synaptogyrin (loading control). To verify the genotypes of the samples analyzed, a DMob4 immunoblot is shown for the undiluted extract. Lanes 1–6, 6.5 μg protein/lane × 1, (3/7)1, (3/7)2, (3/7)3, (3/7)4, and (3/7)5. For quantitative analysis of α-Tubulin levels, protein samples (n = 8) at 6.5 μg × (3/7)3/lane were analyzed using an Odyssey infrared scanner with the data normalized to Synaptogyrin levels. Mean integrated intensity units: DMob4, 6.96 ± 0.84; control, 8.59 ± 1.09; p = 0.26. Error bars are SEM.

