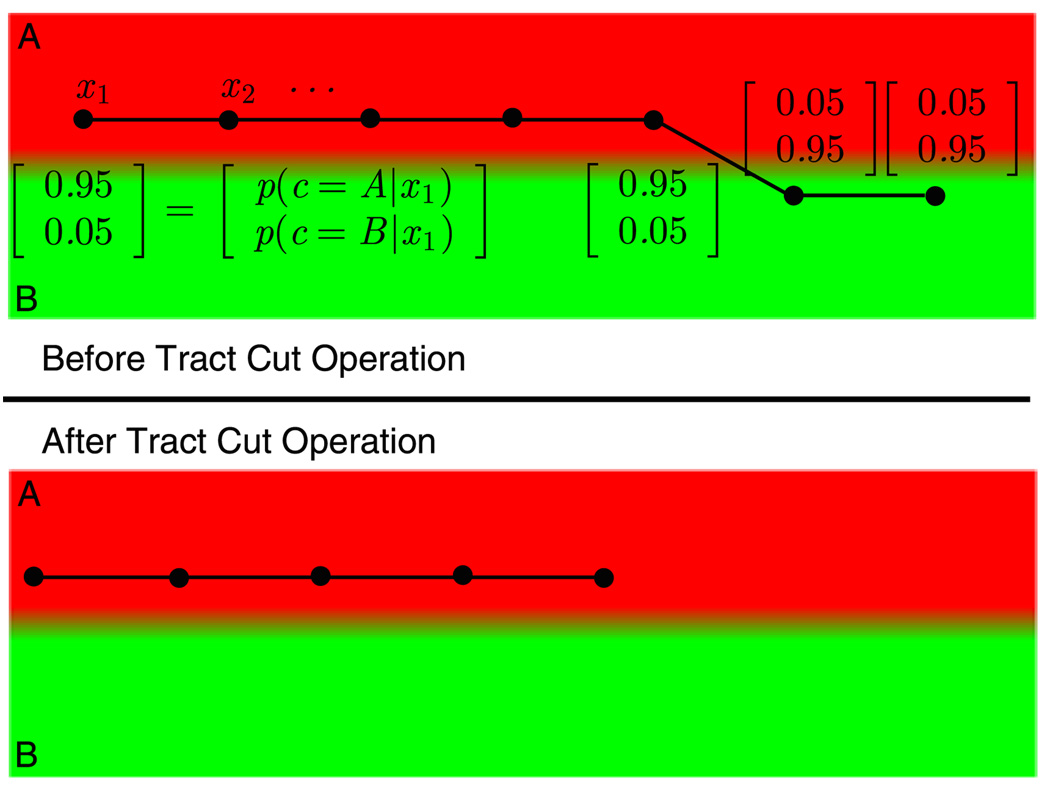
Fig. 2.
(Color online) Illustration of the tract cut operation. The atlas contains two labels: A (in red) and B (in green). Each sample of the tract has been assigned a probability vector, p(c|xi) for c ∈ {A, B}. The overall tract label is determined as the one that maximizes the tract likelihood: p(c|t) ∝ p(c) × Πi p(xi|c). However, there are parts of this tract that does not agree with the tract’s overall label. Tract cut operation removes these parts of the tracts

