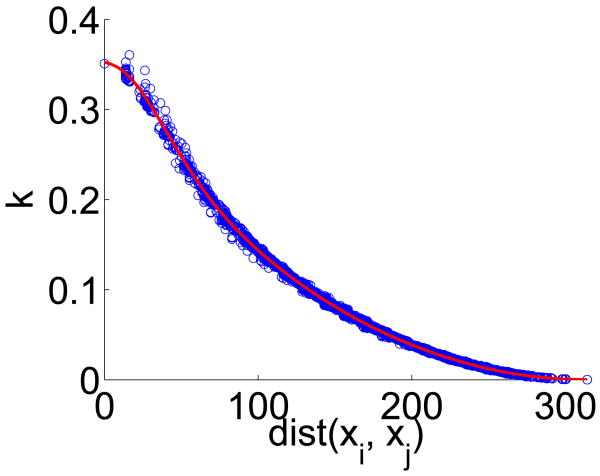
Fig. 8.
Approximating the kernel function k(xi, xj). The scattered points corresponds to the estimation of k*(xi, xj) via Eq. (51). The red curve corresponds to fitting the scattered points so that k̃(xi, xj) is strictly a function of the geodesic distance between xi and xj.

