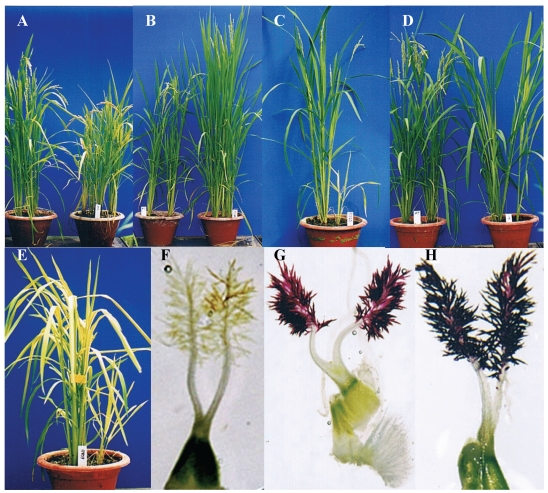
Figure 5.
Phenotype investigation of Ds insertion lines. Left image is wild type (WT) control and right image is mutant line in A to D. (A) Dwarf phenotype. (B) Taller mutant. (C) weak-growth mutant, (D) Late-flowering mutant. E, Yellow-leaf mutant. F, Stigma in WT. G and H, Stigmas with brown color.

