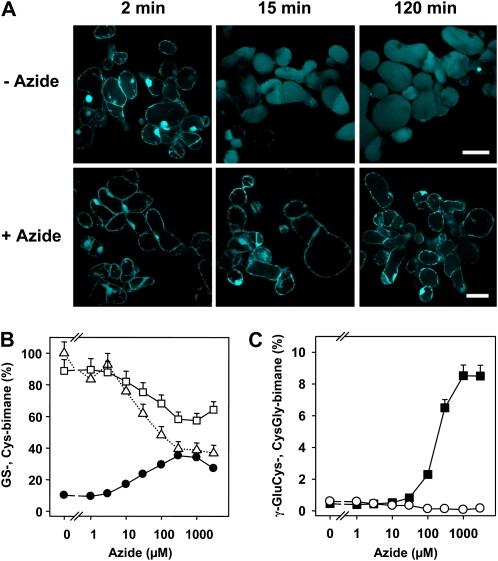
Figure 2.
Effect of azide on GS-bimane catabolism. A, Confocal images of MCB-exposed suspension cells as in B and C in the absence (−azide) and in the presence (+azide) of 1 mm azide. The analysis reveals rapid accumulation of fluorescent bimane derivatives in the vacuole, while azide administration resulted in no significant fluorescence in the vacuole. The time points given indicate the incubation time after exposure to 5 μm MCB for 1 min and subsequent transfer of the cells to MCB-free medium. Bars = 50 μm. All images were taken from one experimental series with identical settings. B and C, Cells of an Arabidopsis suspension culture were exposed to different azide concentrations (5 min) prior to a 1-min exposure to MCB (5 μm). Subsequently, cells were incubated in MCB-free medium with the previous azide level. GS-bimane (white squares) and Cys-bimane (black circles) levels in B and CysGly-bimane (white circles) and γ-GluCys-bimane (black squares) amounts in C were determined 30 min after MCB challenge. For each inhibitor concentration, the sum of bimane derivatives including GS-bimane was set to 100%. The dotted line in B represents the values of the sum of bimane derivatives relative to the level of untreated cells (292 nmol g−1 dry weight). Data points represent means of duplicates ± sd. An independent experiment yielded comparable results.

