Figure 3.
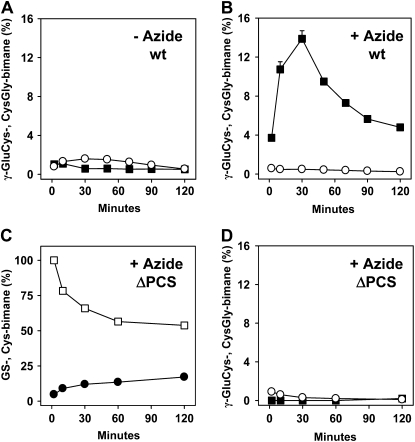
Time course of turnover of GS-bimane. A and B, Levels of CysGly-bimane (white circles) and γ-GluCys-bimane (black squares) in Arabidopsis wild-type (wt) cells in the absence (A) and presence (B) of 1 mm azide. C and D, Analysis of ΔPCS cell suspension culture for GS-bimane (white squares) and Cys-bimane (black circles) levels (C) and CysGly-bimane (white circles) and γ-GluCys-bimane (black squares) amounts (D). Cells were exposed to 1 mm azide. The initial amounts of GS-bimane and bimane derivatives were set to 100% at the onset of the experiment. The total levels were 448, 307, and 207 nmol g−1 dry weight bimane derivatives for the wild type (−azide and +azide) and ΔPCS (+azide), respectively. Data points represent means of duplicates (deviation < 10% of value), and two independent repetitions yielded similar results. Incubation conditions are as mentioned in Figure 2.

