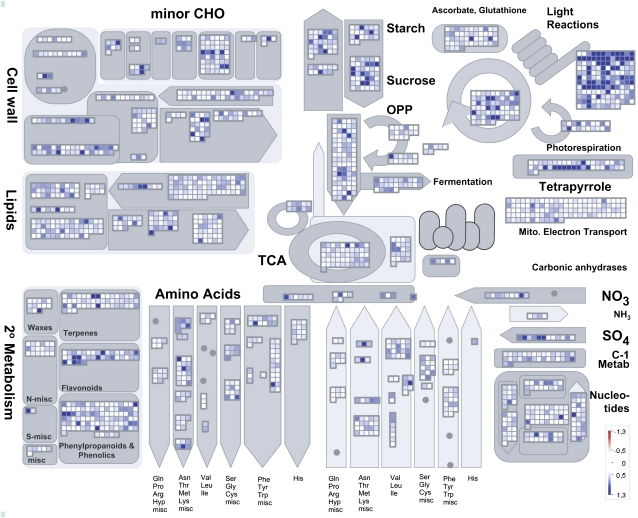
Figure 3.
MapMan display showing diurnal amplitudes of 17,416 present genes in a metabolism overview map. Genes on the Barley1 microarray are represented by individual squares. Genes with increasingly large amplitudes are shown as an increasingly intense blue saturating at an amplitude of 1.3 (log2 value). Genes with no significant change in the amplitude are shown in white. CHO, Carbohydrate; OPP, oxidative pentose phosphate; TCA, tricarboxylic acid.

