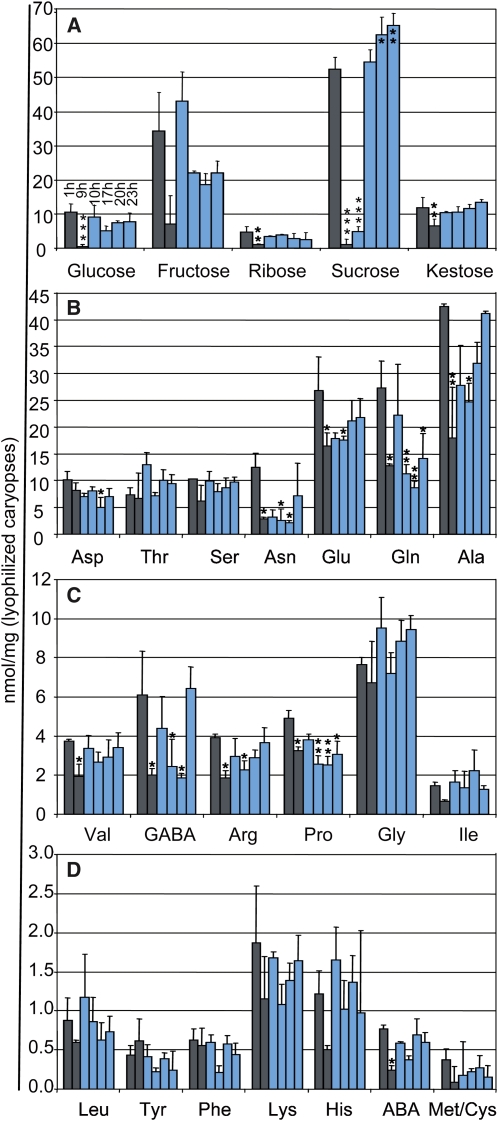
Figure 4.
Levels of sugars and amino acids undergoing diurnal fluctuations in developing caryopses of barley. A, The amount of sugars was determined at six times during the day. B to D, The amount of indicated amino acids was determined at six times during the day. Sampling times were as indicated for the Glc samples in A. Gray and light blue bars depict times in darkness and light, respectively. The data are displayed as means + sd. Significant differences compared with the first sample (1 h) are indicated by asterisks (* P ≤ 0.01, ** P ≤ 0.001, *** P ≤ 0.0001).

