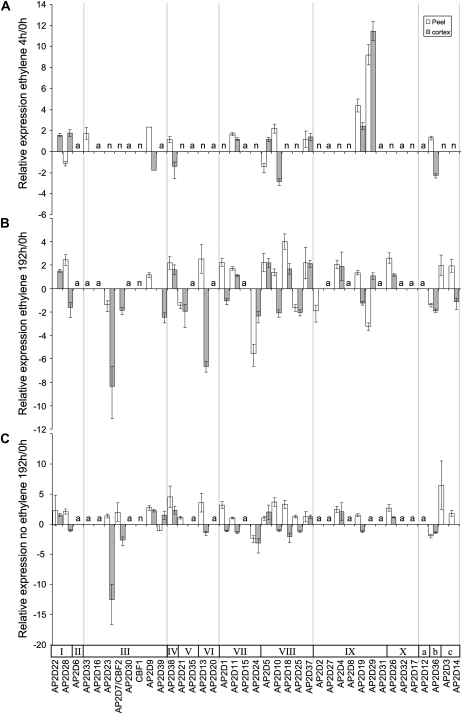
Figure 6.
Relative expression analysis of apple AP2 genes in the E1 harvest of ACO1-suppressed apples that have been induced with ethylene. Values represent expression relative to the 0-h sample. A, Expression after a 4-h, 100 μL L−1 ethylene treatment. B, Expression after a 192-h, 100 μL L−1 ethylene treatment. C, Expression after 192 h in an ethylene-free environment. The genes are arranged in order of cluster groupings. Other features are as described in Figure 5.

