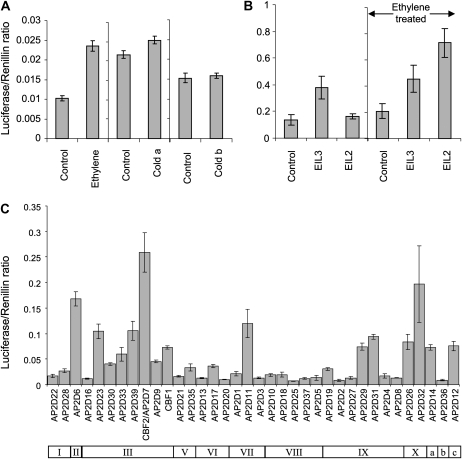
Figure 7.
Tobacco transient assay of plants infiltrated with PG1-Luc. Transactivation of the promoter is measured as a ratio of the luciferase signal to the renillin signal. A, PG1-Luc-infiltrated plants with or without 100 μL L−1 ethylene for 24 h prior to assay. PG1-Luc-infiltrated plants were kept at either 20°C or 4°C for 24 h prior to assay (cold a) or for 4°C for 24 h followed by 20°C for 2 d (cold b). B, Coinfiltration of PG1-Luc with EIL1 or EIL2 with or without a 24-h, 100 μL L−1 ethylene treatment. C, Coinfiltration of PG1-Luc with 37 different apple AP2 domain-containing genes. The bar underneath represents the cluster groups as defined in Figure 5. Error bars represent se (n = 4).

