Figure 3.
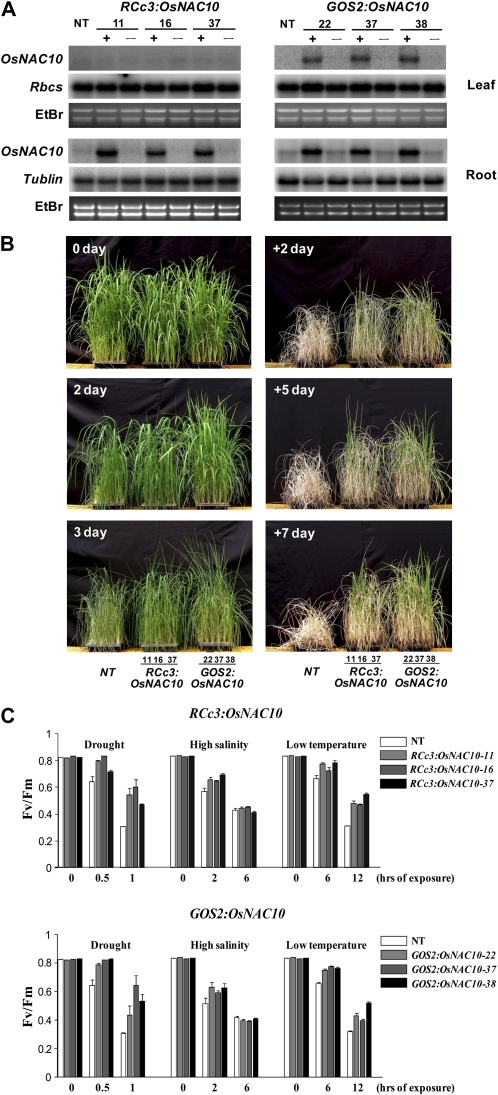
Stress tolerance in vegetative stage RCc3:OsNAC10 and GOS2:OsNAC10 plants. A, RNA gel-blot analyses were performed using total RNA preparations from the roots and leaves of three homozygous T4 lines of RCc3:OsNAC10 and GOS2:OsNAC10 plants, respectively, and of NT control plants. The blots were hybridized with OsNAC10 gene-specific probes and also reprobed for RbcS and Tubulin. Ethidium bromide (EtBr) staining was used to determine equal loading of RNAs. – indicates nullizygous (without transgene) lines, and + indicates transgenic lines. B, The appearance of transgenic plants during drought stress. Three independent homozygous T4 lines of RCc3:OsNAC10 and GOS2:OsNAC10 plants and NT controls were grown for 4 weeks, subjected to 3 d of drought stress, and followed by 7 d of rewatering in the greenhouse. Photographs were taken at the indicated time points. + denotes the number of rewatering days under normal growth conditions. C, Changes in the chlorophyll fluorescence (Fv/Fm) of rice plants under drought, high-salinity, and low-temperature stress conditions. Three independent homozygous T4 lines of RCc3:OsNAC10 and GOS2:OsNAC10 plants and NT controls grown in MS medium for 14 d were subjected to various stress conditions as described in “Materials and Methods.” After these stress treatments, the Fv/Fm values were measured using a pulse modulation fluorometer (mini-PAM; Walz). All plants were grown under continuous light of 150 μmol m−2 s−1 prior to stress treatments. Each data point represents the mean ± se of triplicate experiments (n = 10).

