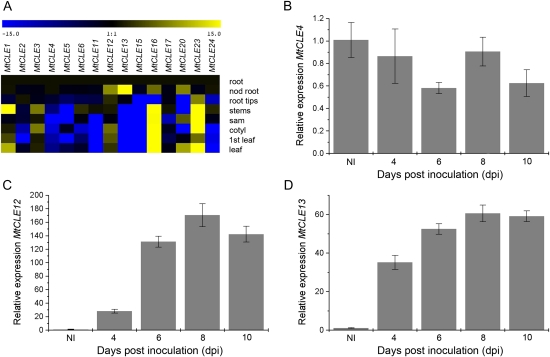
Figure 1.
Expression analysis of MtCLE genes. A, Heat map of MtCLE expression in different tissues as measured by qRT-PCR. Samples are cDNA from root elongation zones (root), nodulated roots 1 month post inoculation (nod root), root tips, stems, SAMs (sam), cotyledons (cotyl), first leaves (1st leaf), and mature leaves (leaf). B to D, Expression analysis of MtCLE4, MtCLE12, and MtCLE13, respectively, by qRT-PCR on cDNA samples of zone I root tissues of uninoculated plants (NI) and at 4, 6, 8, and 10 dpi.

