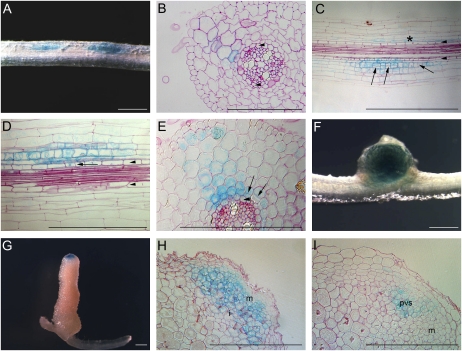
Figure 3.
MtCLE13 promoter activity during nodulation. A, Transgenic pMtCLE13:GUS root segment of the susceptible root zone I at 3 dpi. GUS staining was observed in patches along the root. B, Transverse section through a root segment at an initial stage of nodule formation when still no cell divisions occur. Blue staining is the highest in the inner cortical cells. Arrowheads indicate pericycle. C and D, Longitudinal sections through the root segment shown in A. In the incipient nodulation event (indicated by an asterisk in C), staining is seen in inner cortical cells but not in the pericycle cells. In slightly more developed nodule primordia, where cell divisions are visible in cortex and pericycle (examples marked by arrows in C and D), GUS staining is the strongest in the dividing cells of the cortex but also in the pericycle. E, Transverse section through a young developing nodule primordium at a stage similar to that in D. Cell division is clearly visible in the cortex (arrows). The pericycle cell file is indicated by arrowheads (in C–E). pMtCLE13:GUS is expressed in the cortex and at a low level in the pericycle, with the highest expression in the dividing inner cortical cells. F, A round, young nodule with GUS staining throughout the nodule tissue. G, GUS staining of a mature, elongated nodule. H, Longitudinal section through an elongated nodule. GUS staining is seen in the meristematic tissue and early infection zone. I, Longitudinal section through an elongated nodule, in which the expression is the highest in cells that presumably correspond to the provascular strands. i, Infection zone; m, meristem; pvs, provascular strands. Bars = 1 mm (A, B, D, F, and G) and 0.5 mm (C, E, H, and I).

