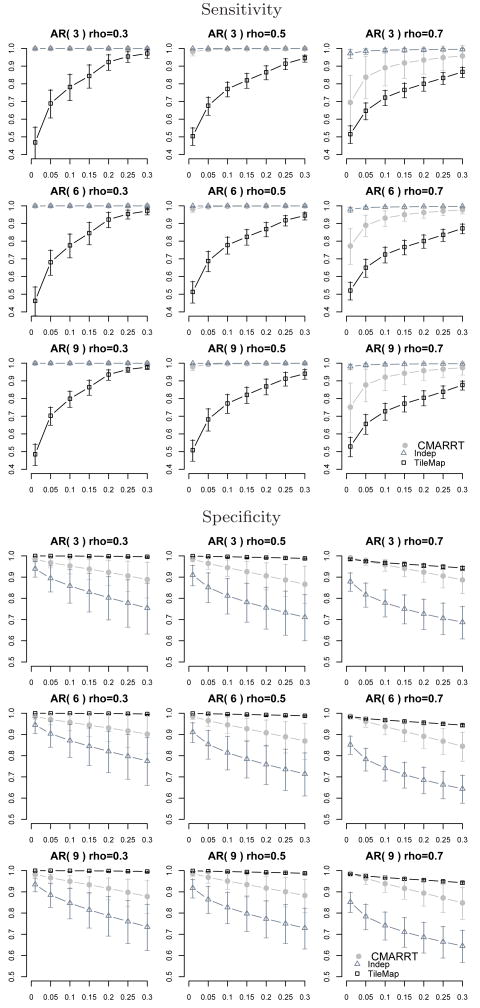
Fig. 3. Sensitivity at peak level (top figure) and specificity (bottom figure) at various FDR control (x-axis).
The background N is generated from various autoregressive models with sd(Ni)=0.3, Yi = Ni + 1.5, p = {3, 6, 9} and ρ = {0.3, 0.5, 0.7}. Vertical lines are error bars. CMARRT is able to identify most of the bound regions at FDR of 0.05 and above. TileMap tends to be more conservative in declaring bound regions. Although Indep gives the highest sensitivity, it also has the highest proportion of false positives. The specificity for CMARRT is significantly higher than the Indep approach.

