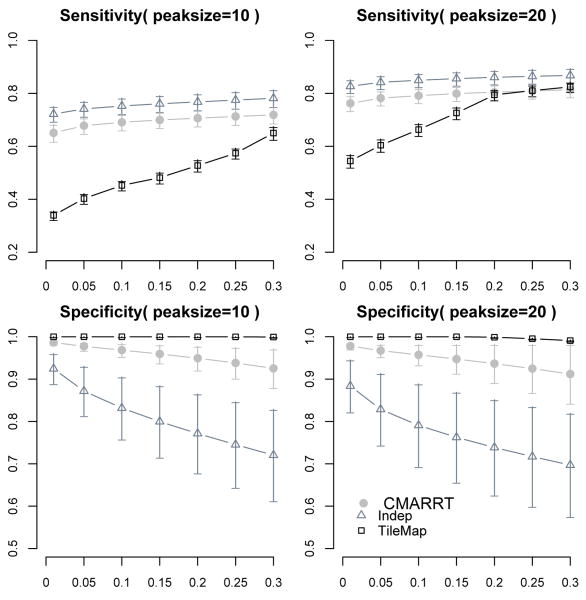
Fig. 4. Sensitivity and specificity at various FDR control (x-axis).
The left panels are the results under duration HMM simulation with average peak size of 10 probes. The right panels correspond to using average peak size of 20 probes. TileMap tends to be more conservative and has the lowest sensitivity and highest specificity. CMARRT is able to achieve a balance between sensitivity and specificity at each FDR threshold. Indep tends to identify many false positives.

