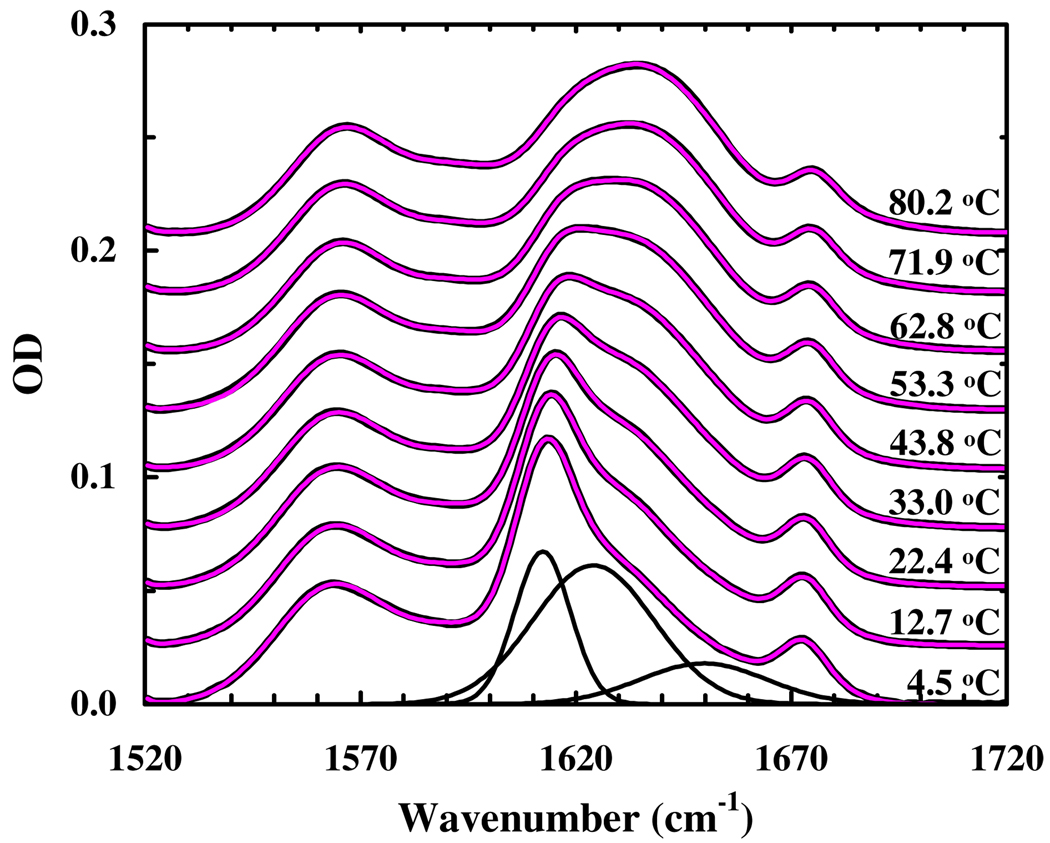
Figure 1.
FTIR spectra of the β-peptide (in the amide I′ region) measured at different temperatures, as indicated. These data have been offset for clarity. The thin red lines represent the best global fits of these data to the model discussed in the text. The black lines represent the spectral components obtained for the 4.5 °C spectrum.

