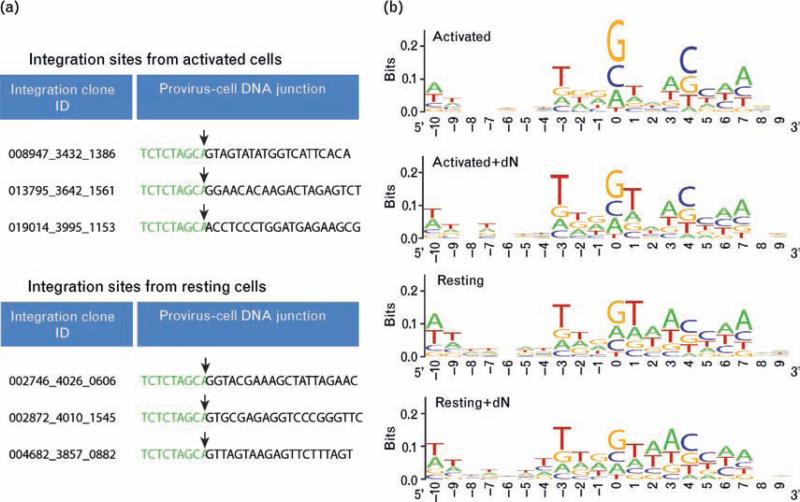
Fig. 2. Primary human DNA sequences at sites of integration.
(a) Examples of sequences recovered from resting and activated cells. HIV long terminal repeat (LTR) sequence is shown in green with 25 bp of human genomic sequence in black. The viral-host DNA junction is marked by an arrow. (b) Information content at aligned integration target sites from activated and resting integration site data sets. The Y-axis indicates base conservation, with perfect conservation equaling two bits and no conservation equal to zero. The X-axis shows nucleotide positions relative to the integration site (10 bases on each side with the point of integration between positions –1 and 0).

