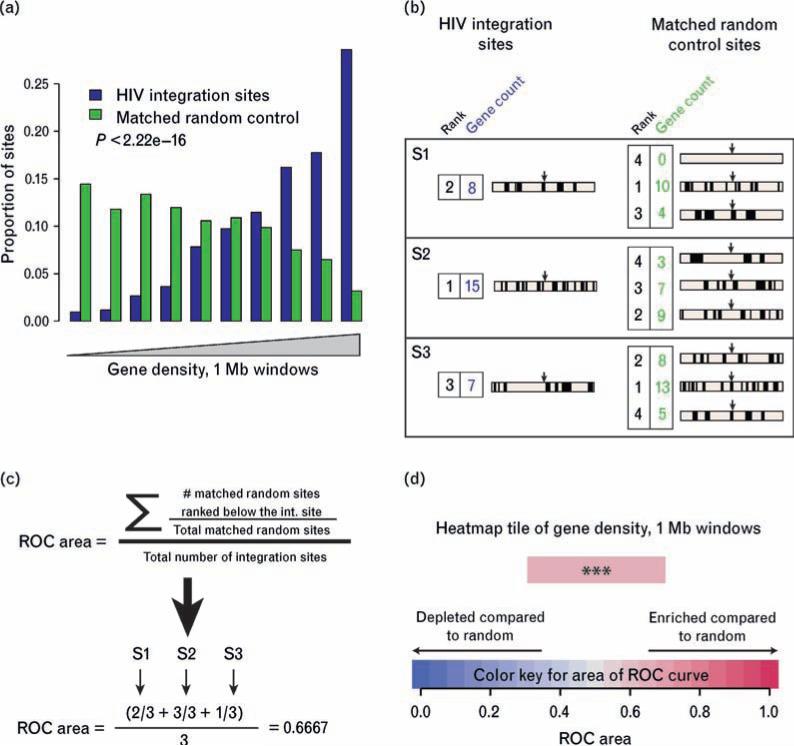
Fig. 3. Construction of heat maps using the receiver operating characteristic area method.
(a) Conventional histogram of data from the activated cell data set (without added deoxynucleosides) showing favored integration of HIV in gene-dense regions. All integration sites and matched random controls were annotated for gene density in the 1 Mb region surrounding the integration site. The pool of sites was then separated into 10 equal bins by relative gene density, with lower gene density to the left and higher to the right. The proportions of the experimental sites and matched random controls were then plotted for each bin, allowing visualization of the higher proportions in the experimental set at higher gene densities compared with the control set. (b) Annotating and ranking integration sites and matched random controls for construction of receiver operating characteristic (ROC) areas. Genes are represented by short vertical lines, integration sites by arrows. The gene count is shown beside each genomic interval; the rank over the pooled data set is shown colored blue for experimental integration sites or green for matched random controls. (c) Use of rank information to generate the ROC areas. For each set of one experimental site and three matched random controls, the experimental site is ranked relative to the matched random control. Positive correlation is indicated by values greater than 0.5, negative correlation as values less than 0.5. (d) Color-coding of heatmap tiles. Increasingly intense shades of red = enriched compared to random; increasing shades of blue depleted compared to random. The heatmap tile in (d) represents the same data shown in histogram form in (a). The P value, determined by a logistic regression method that respects the pairing in the data (clogit), is overlaid on the heatmap tile. (*P < 0.05; **P < 0.01; ***P < 0.001).

